Analyzing COVID-19 Impact on NYC Taxis with DuckDB

Data analytics made easy with DuckDB integration: Run complex queries on your data effortlessly.
The world of data analytics is constantly evolving, with new tools and technologies emerging every day. One popular new tool is DuckDB, open-source software touted as a faster, more efficient alternative to traditional databases.
So, what exactly is DuckDB, and why is it gaining so much attention in the data analytics community? In simple terms, DuckDB is a SQL database management system that is designed to handle analytical workloads. Unlike traditional databases that are optimized for transactional workloads, DuckDB is optimized for analytical workloads, making it the preferred choice for data analysts and data scientists.
DuckDB stands out for its speed and capacity to handle sizable datasets. In this article, we'll look at DuckDB's capabilities by running analytical queries on a few gigabytes of NYC taxi data, all within a Flyte workflow. In the process, we'll provide insight into how COVID-19 affected pickups, drop-offs, and peak and off-peak hours for NYC taxis, and how Flyte can expedite analytical queries.
Fetching pickup and drop-off hours over a span of 4 years
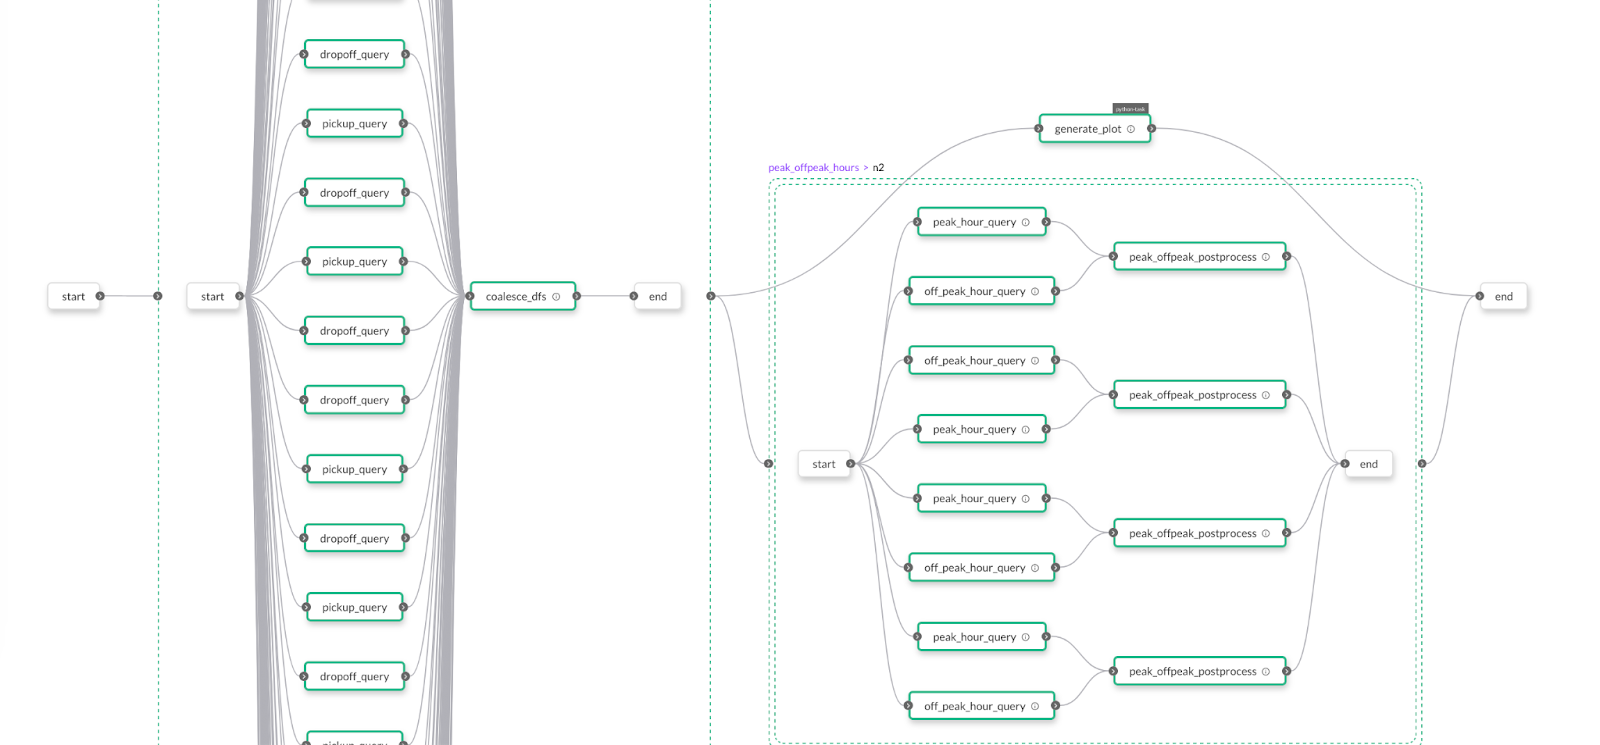
Start by retrieving the pickup and drop-off hours of NYC taxis from 2019 to 2022 from the parquet files. Since each parquet file corresponds to a specific year and month, execute queries on each data file using a loop. To handle this dynamic task, utilize flytekit's `@dynamic` workflow.
Send the resulting list of pickup and drop-off structured datasets to a `coalesce_dfs` task. This task is responsible for coalescing the structured datasets into a single list, grouping the pickup and drop-off values by year.
Define `peak_hour_output` and `vaex_dfs_list` types as follows:
`pickup_query` and `dropoff_query` refer to the DuckDB queries that need to be executed on the parquet files. In Flytekit, a DuckDB query can be defined using the `DuckDBQuery` task. This task requires specification of the task name, the query or list of queries to be executed, and any input parameters required by the query.
To install the DuckDB plugin, run the following command:
To obtain the number of trips for every hour, along with their corresponding pickup and drop-off values, we construct two queries. Design the queries to operate on the parquet file, which will be used as the input data source.
The `pickup_query` and `dropoff_query` tasks are triggered simultaneously in the `@dynamic` workflow, resulting in expedited executions!
Now, we define a `coalesce_df` task to merge the structured datasets for each year.
- For each pickup and drop-off structured dataset dictionary, add the corresponding year as a key-value pair to the dictionary.
- Sort the structured datasets by year.
- Iterate through the structured datasets, and for each dataset, load it into a Vaex dataframe. Concatenate the pickup dataframe with the previous pickup dataframe, and the drop-off dataframe with the previous drop-off dataframe until all the 12 months have been considered.
- Once the Vaex dataframes for a year are obtained, group the pickup and drop-off dataframes by hour, and join them together.
- Store the resulting dataframe in a list and repeat the process for the next year.
The result will be a list of Vaex dataframes.
Note: Vaex is designed to handle and process large datasets. It can be helpful in our case to expedite the aggregations and joins of dataframes. Flyte provides native support for Vaex dataframes. You can install the library by running the following command:
Visualizing data through plot rendering
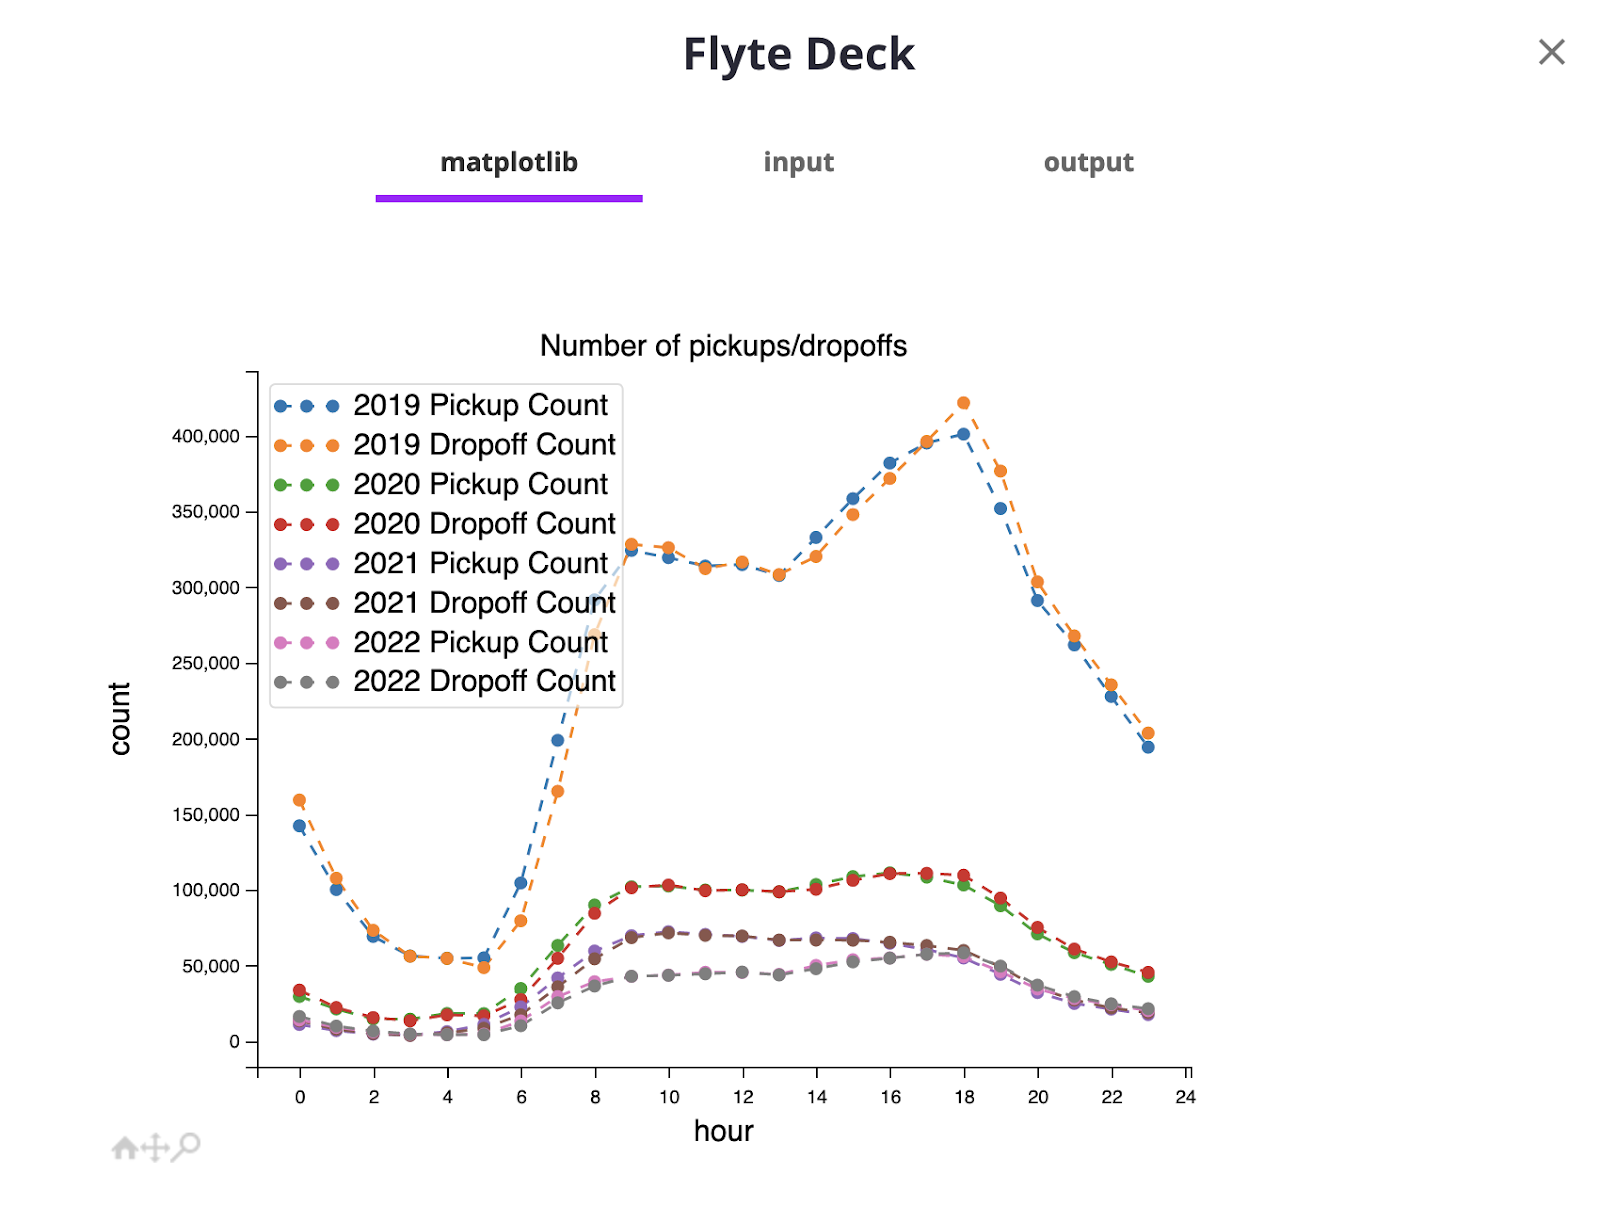
To estimate the impact of COVID-19 on NYC taxi trips, we can create a visual representation of the pickups and drop-offs between 2019 and 2022.
Install the following libraries prior to rendering the plot:
The plot suggests that in 2019, there were significantly more instances of pickups and drop-offs compared to 2020, 2021, and 2022. At 18:00 hour, for instance, there was a noticeable drop in pickups from about 400,000 in 2019 to roughly 90,000 in 2020, and even lower at around 50,000 in 2021 and 2022.
Retrieving the peak and off-peak hours
To retrieve the peak and off-peak hours for each year from 2019 to 2022, we can follow these steps:
- Define a `@dynamic` workflow to loop over the Vaex dataframes retrieved from the `coalesce_dfs` task.
- Generate an Arrow table from every Vaex dataframe.
- Execute two DuckDB queries to retrieve peak and off-peak hours by sending the arrow tables to the queries.
- Define a post-processing task to retrieve the peak and off-peak hours from the dataframes.
- Return the result.
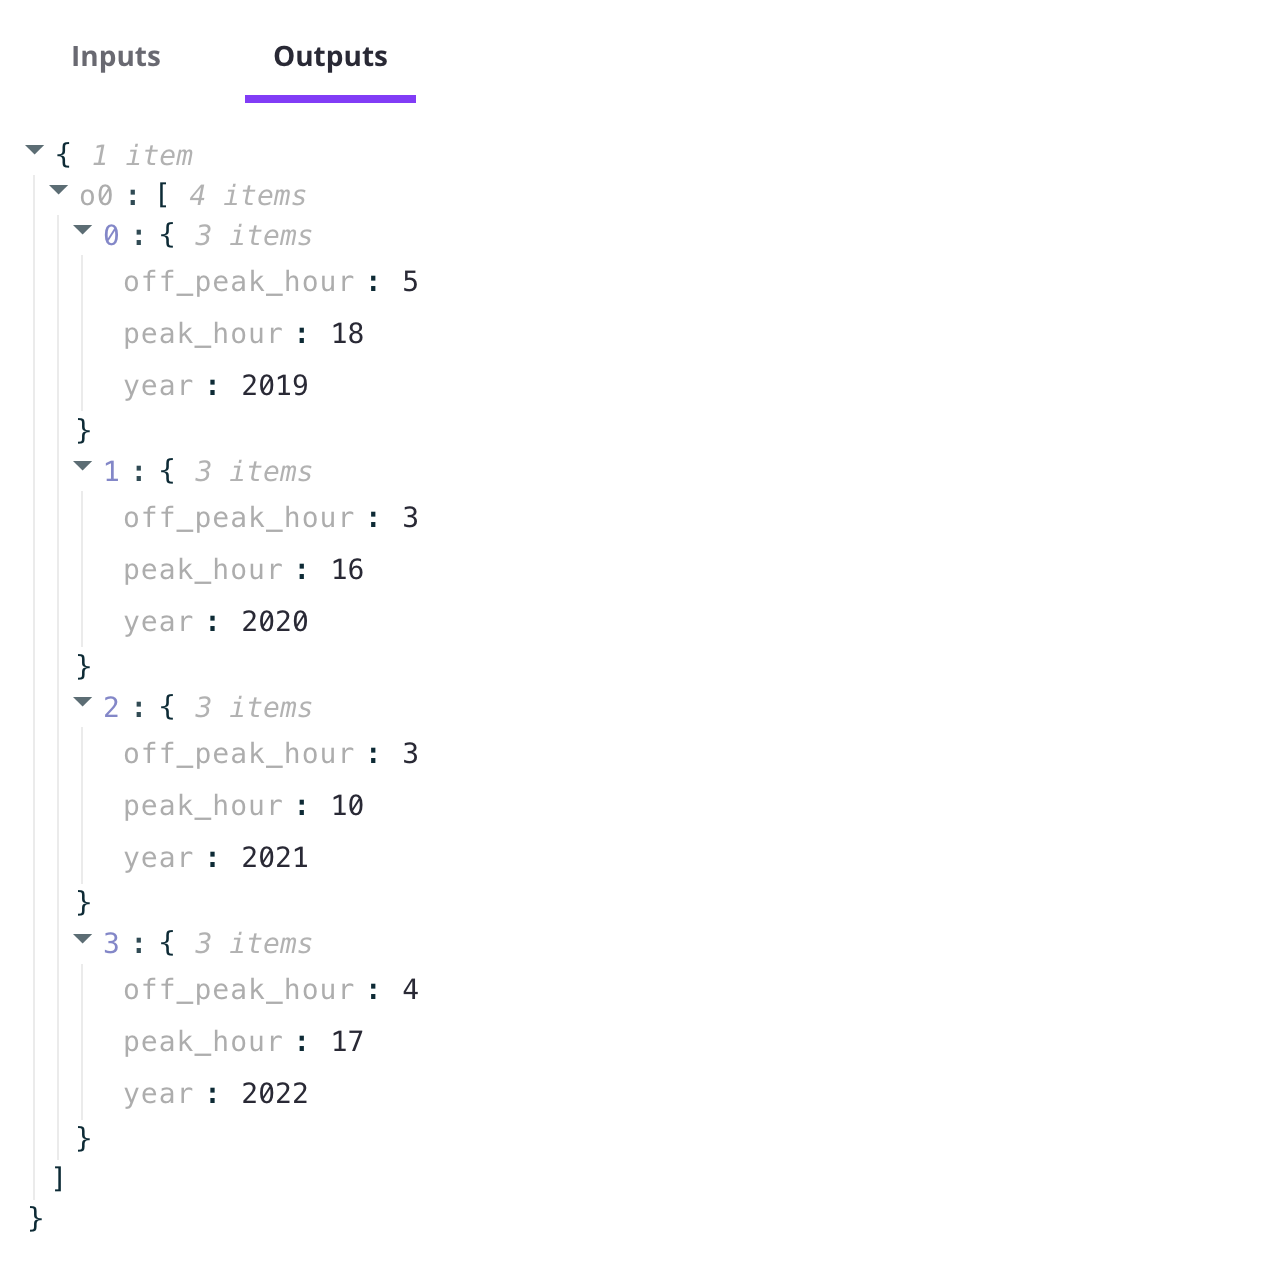
`peak_hour_query` and `off_peak_hour_query` execute SQL queries on the Arrow tables and retrieve the peak and off-peak hours, respectively.
Peak hour refers to the hour with the highest number of pickups and drop-offs, while off-peak hour refers to the hour with the lowest number of pickups and drop-offs.
`PeakOffPeak` is a data class that specifies the format for storing the year, peak hour, and off-peak hour.
Running the workflow
You can execute the workflow either locally or on a Flyte cluster. To establish dependencies between tasks, build a Flyte workflow using the following steps:
Note: The source code is available on GitHub Gist.
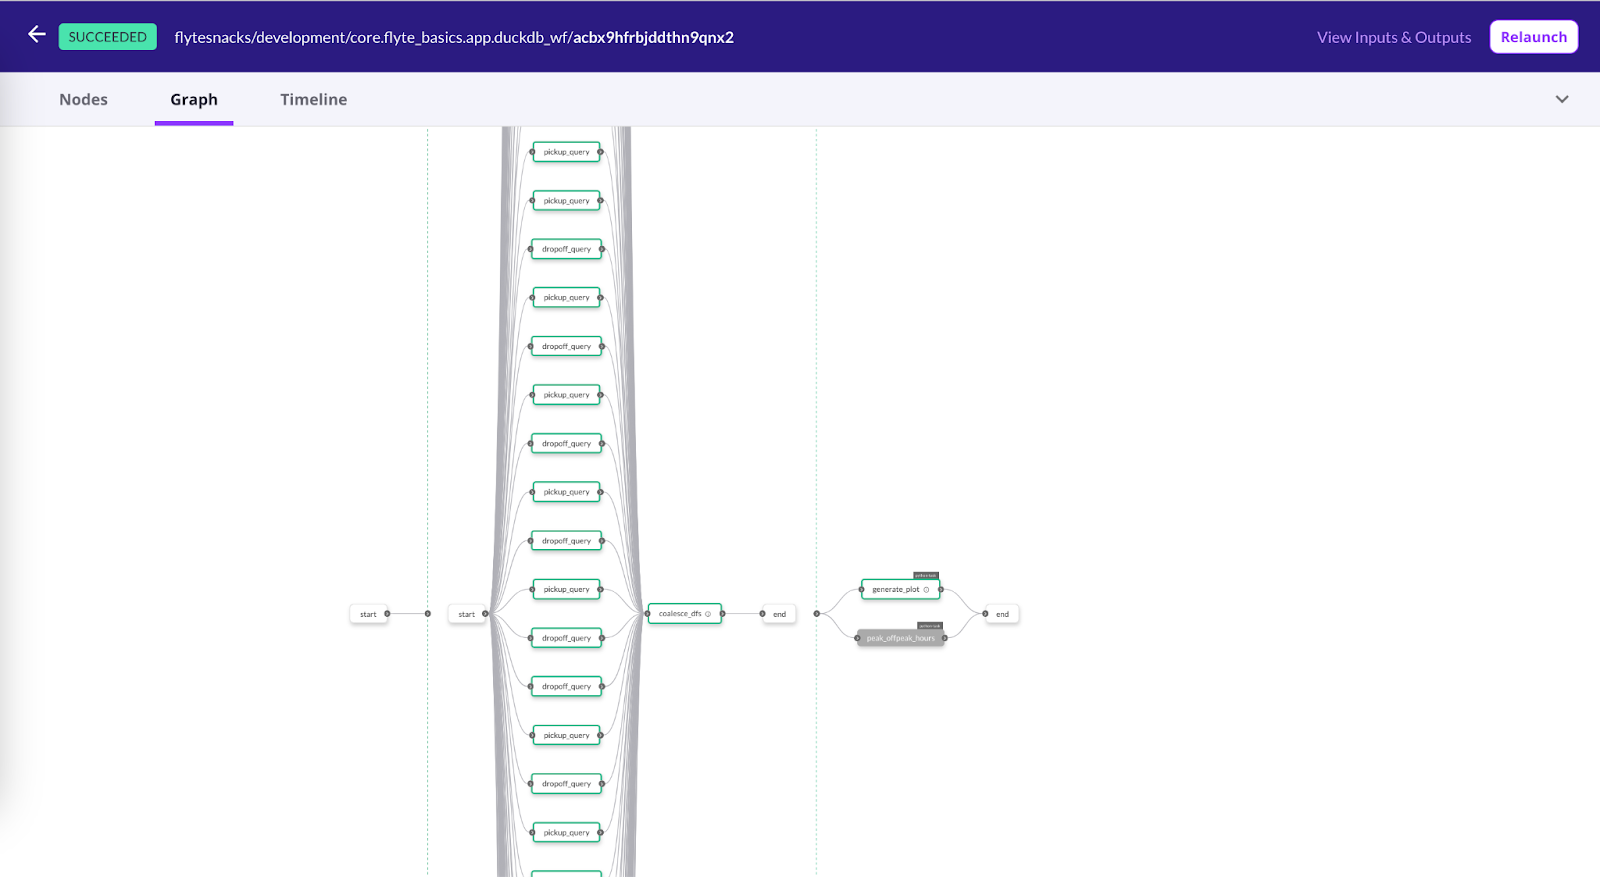
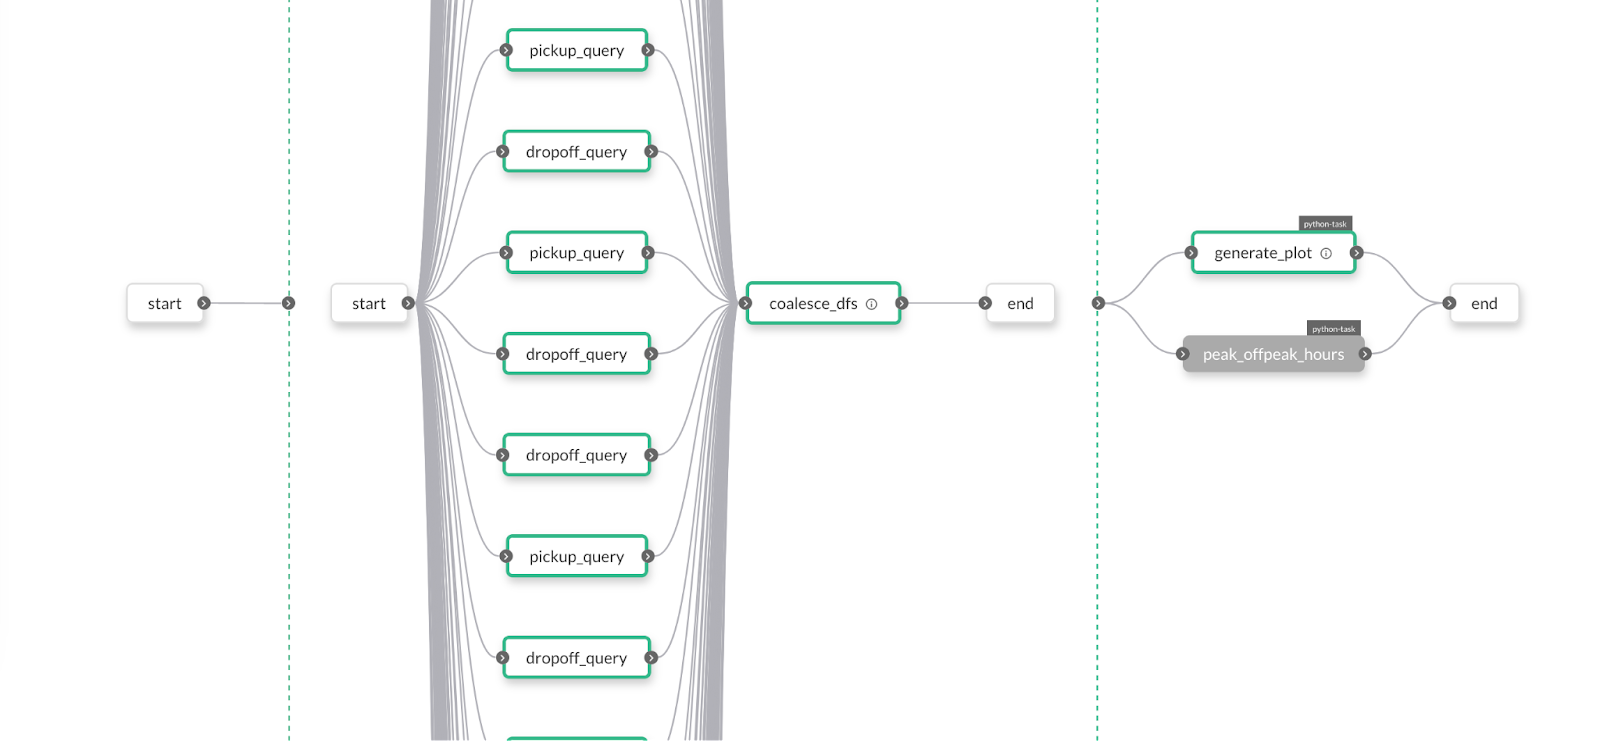
Note: You may come across access denied errors when hitting multiple CloudFront URLs to retrieve the data. In such a scenario, wait for about an hour and recover the existing execution. This way, you can prevent re-execution of successful Parquet file executions. Flyte's recoverability feature can help!
Summary
In conclusion, leveraging the Flyte x DuckDB integration can simplify the execution of complex analytical workloads on Flyte. If you are interested in running DuckDB queries within Flyte, here are some valuable resources to explore:
- Review our documentation to gain a better understanding of how to use the Flyte x DuckDB integration.
- Take a look at our plugin code to get a better sense of how the integration works under the hood.
- Join our Slack community if you have any questions or want to engage with other users who are using Flyte x DuckDB.
- Give the Flyte repository a ⭐ on GitHub and follow us on Twitter to stay informed about the latest updates and enhancements.
- Create a GitHub issue if you run into any bugs and let us know.
By leveraging the Flyte x DuckDB integration, you can optimize your analytical workflows for greater efficiency.


